More data will be made available soon.
Mobility at a glance
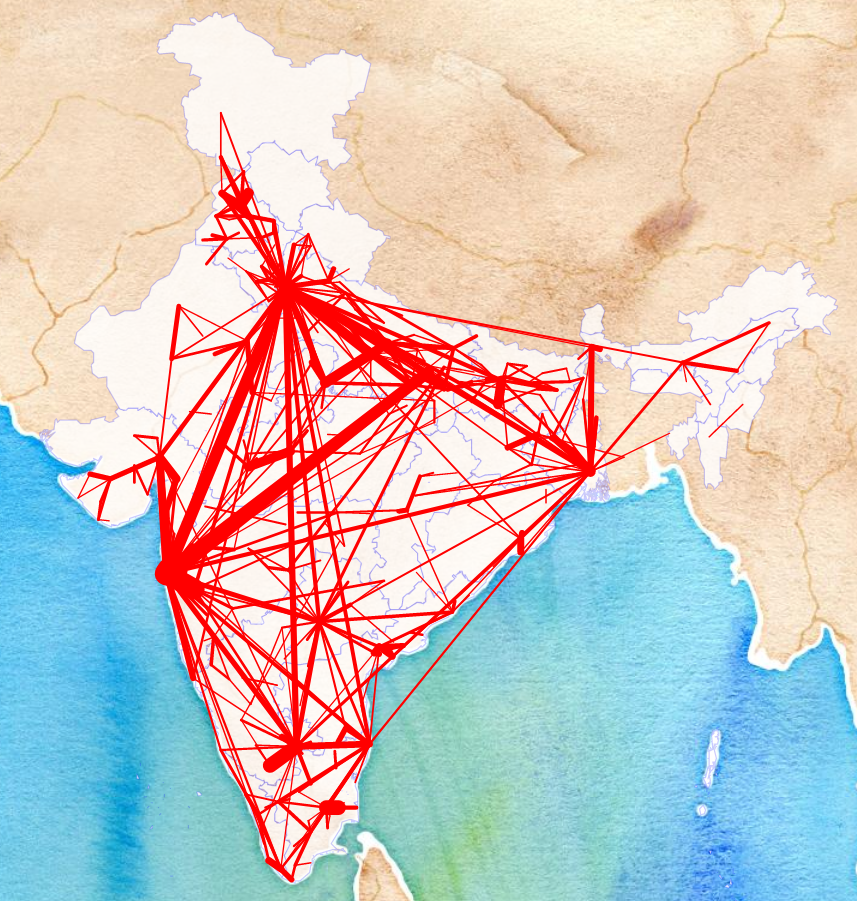
In the above image, lines represent the connections between cities and their thickness indicates its relative importance – the thicker the line, the more people travel in that route, and hence more important. To avoid clutter, this figure shows only the top 500 of the 23224 undirected connections in the network.
| Property | Airway | Railway | Roadway | Combined |
|---|---|---|---|---|
| Number of cities (nodes) | 85 | 435 | 446 | 446 |
| Number of connections (edges) | 1182 | 41594 | 9128 | 46448 |
| Average number of connections (average degree) | 13 | 95 | 20 | 104 |
| Number of passengers per day (in lakhs) |
7.5 | 88 | 25 | 120 |
| Fraction of total | 0.06 | 0.73 | 0.21 | 1.0 |
A few properties of the network used in our analysis are shown above in the table. We consider all the three major modes of transport - air, rail, and road. You can find more information from our paper : Current Science 121, 1208 (2021) or arXiv/2105.15123.